| Step
8 - Visual Debugger
Quexal includes a
break-through Visual
Debugger that lets you easily pinpoint errors in your code.

The source code is
re-arranged in a graph
showing dependency bonds among instructions (cyan lines). Clicking on
an
instruction highlights its bonds (red lines). The Debugger supports
both
decimal and hexadecimal data formats, and you can switch between the
two
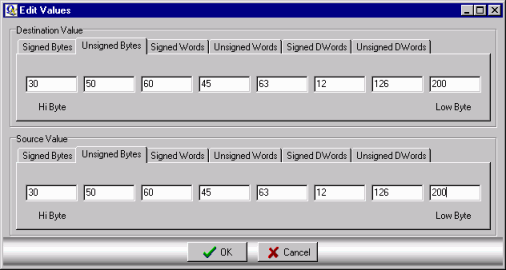
modes by clicking on the Toggle Base button. Double clicking on an
instruction
opens the following dialog:

Here you enter the source
values of memory
reads and examine variables' values, and moving from a data format to
another
is as easy as clicking on the appropriate tab. Pressing the OK button
updates
the variables' values of the selected instruction and recomputes all
steps
in the source code.
The Visual Debugger lets
you effectively
test your code without even compiling and running it! You can enter
the
data values that are read at the beginning of the loop and check the
output
values at the bottom of the loop: if they do not match the correct
ones,
you can move up from the latest instructions step by step (or move down
from the first ones) and find out where are the bugs: when you can see
at the same time all values assigned to a variable during the
computation,
it is much easier to discover errors.
Thanks to the SSE emulator,
you can also
design and test SSE code on a CPU without SSE extensions.

|