| Step
9 - Performance analysis
Quexal includes an
advanced Code Simulator
that is used to benchmark resulting code. You can analyze in depth how
the optimized code performs on the Pentium 4 / Pentium
III / Athlon micro architectures and identify performance hot
spots.
Clicking on Run|Parallelism Chart (F5) opens the following dialog:

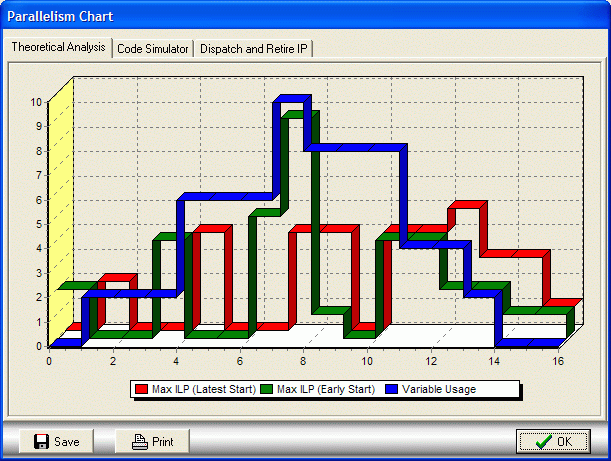
Theoretical Analysis:
this graph
shows how the source code would run on a processor with infinite
resources
(such as infinite execution units and memory accesses). It is useful to
visualize the amount of Instruction Level Parallelism (ILP) and it is
an
upper limit on achievable performance. The Variable Usage data helps
you
decide if a spilling policy is needed.

Code Simulator:
this graph shows
how the optimized code performs on the Pentium III/Athlon micro
architecture.
You can monitor both the decoders (blue line) and the execution units
(green
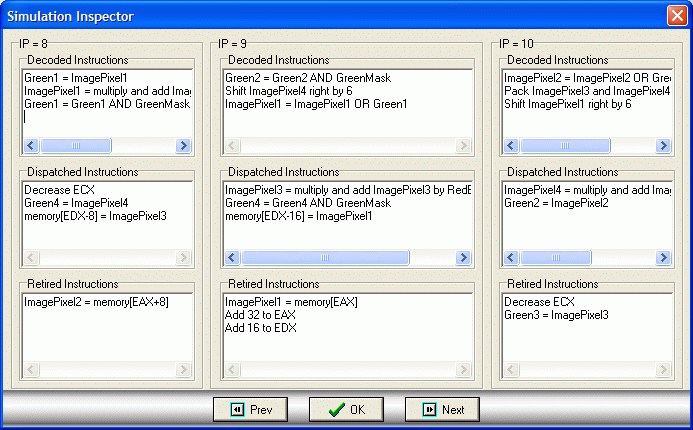
and red lines). Clicking on a line opens up the following window:

This dialog gives plenty
of detail about
what's going on into the CPU: you can see which instruction are
decoded,
dispatched and retired in each cycle.

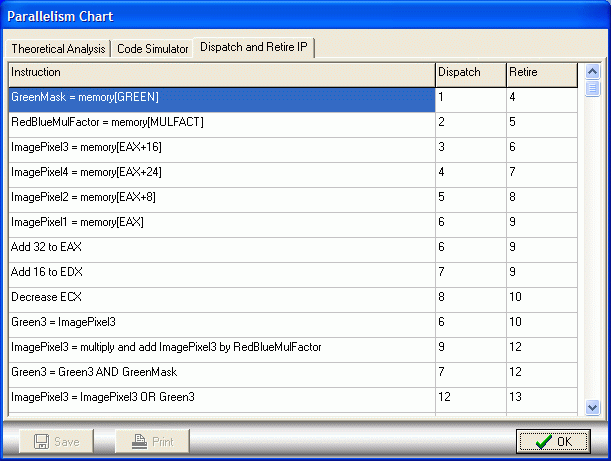
Dispatch and Retire IP:
this table
shows when the instructions, scheduled as in the optimized code, are
dispatched
and retired.

|

